Signal metrics on every site of your probe, live and after
Noise, signal-to-noise, event rate and 12 more metrics, drawn on the probe layout while you record and on any saved recording, so you know which sites to rely on.

Every site gets numbers you can compare
Radiens signal metrics are per-site measurements of an electrophysiology recording, computed by NeuroNexus software while you record and on saved recordings. There are 15, from RMS and noise in µV to signal-to-noise and event rate in Hz, refreshed every 0.5 s on a live stream. They tell you which sites are good while you can still act on it.
See signal quality on the probe while you record
Open Signal Metrics in Allego while streaming. The probe map colors every site by its noise in µV and refreshes every 0.5 s.
Drawn on your probe
Sites sit where they are on the probe, so a bad region reads as a region.
Starts with noise
Noise (µV) is a median-based estimate that spikes don’t inflate.
Every probe
Switch Port or Probe View to check the others.

Choose the metric and the time window
Pick the metric to draw and set the lookback from 500 ms to 10 s. A short window shows what just changed; a long one gives a steadier reading. Custom Scale holds the colors to limits you type.
Amplitude
Mean, Min, Max, Peak-to-Peak, RMS and Noise, in µV.
Events
Event Rate in Hz and event amplitudes, from the thresholds you set. Pro adds four averaged and absolute event measures.
Signal To Noise
The mean event peak divided by the noise, for each site.

Rank the sites in a table
Turn on Table for one row per site and one column per metric. Click a column to sort, filter to the rows you care about, and export the table as CSV.
Sort
By Signal To Noise for the best sites, or by Noise for the worst.
Filter
Show only the rows that meet a condition you set.
Export
Save the table as CSV from the toolbar.

Run the same metrics on a saved recording
Open a recording in Videre and Signal Metrics gives exact values over the window ending at the playback position. Change a filter or a detection threshold and the metrics recalculate.
Exact over the window
Videre computes each value over the window; Allego’s live view is a moving average.
Detection settings
Thresholds per port, positive or negative, in µV or as a multiple of noise.
On a recording in progress
With Open Live, the map follows a recording another system is writing, at Pro.

See the metrics where the sites sit in the brain
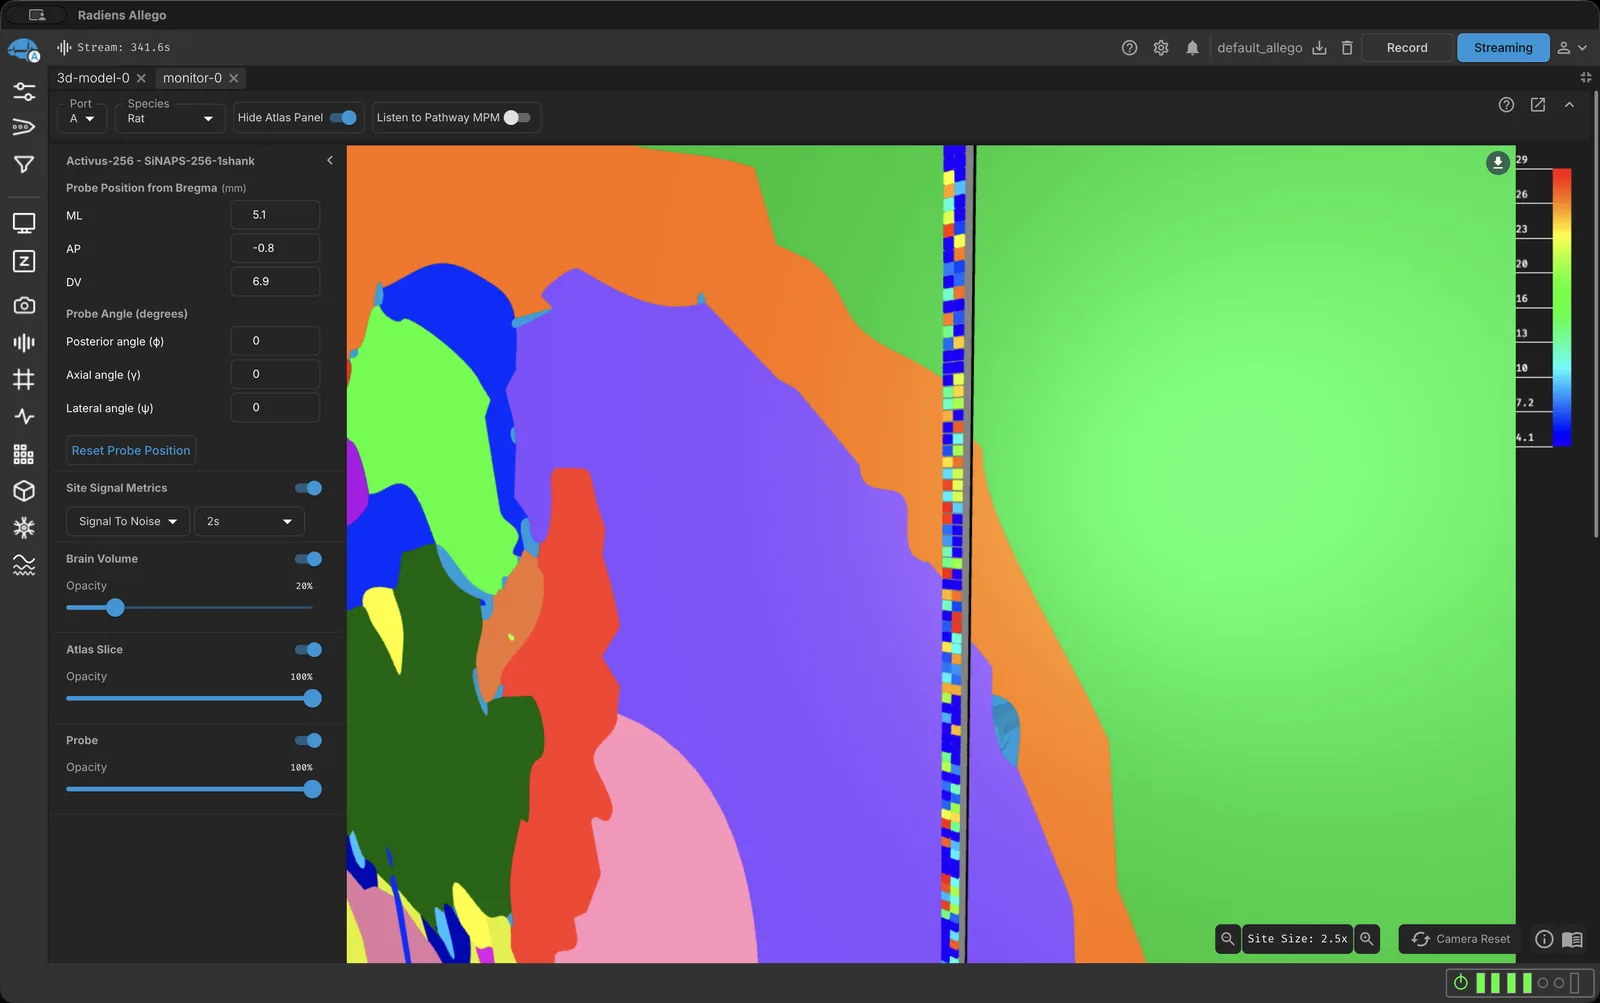
In the 3D Model, switch on Site Signal Metrics to color each site where it sits in the atlas, in Allego and in Videre. You read signal quality against anatomy.
In the atlas
Sites colored on the probe inside the 3D brain model.
Any metric
Choose the metric and the lookback here too.
Live and after
The same switch in Allego and in Videre.
Pull the numbers into Python
RadiensPy returns the same metrics for a whole recording, as a series over time, or summarized across channels, so a quality check can run on every recording in a folder.
Whole recording
One value per channel and metric, over all of it or a time range.
Over time
A series of values per window, to see a metric drift.
Across channels
Mean, max, min, sum and count over the channels.

Where the metrics lead

Follow Live Recording
The same map on a recording that Intan, Open Ephys, Blackrock or TDT software is still writing.
Spike sorting
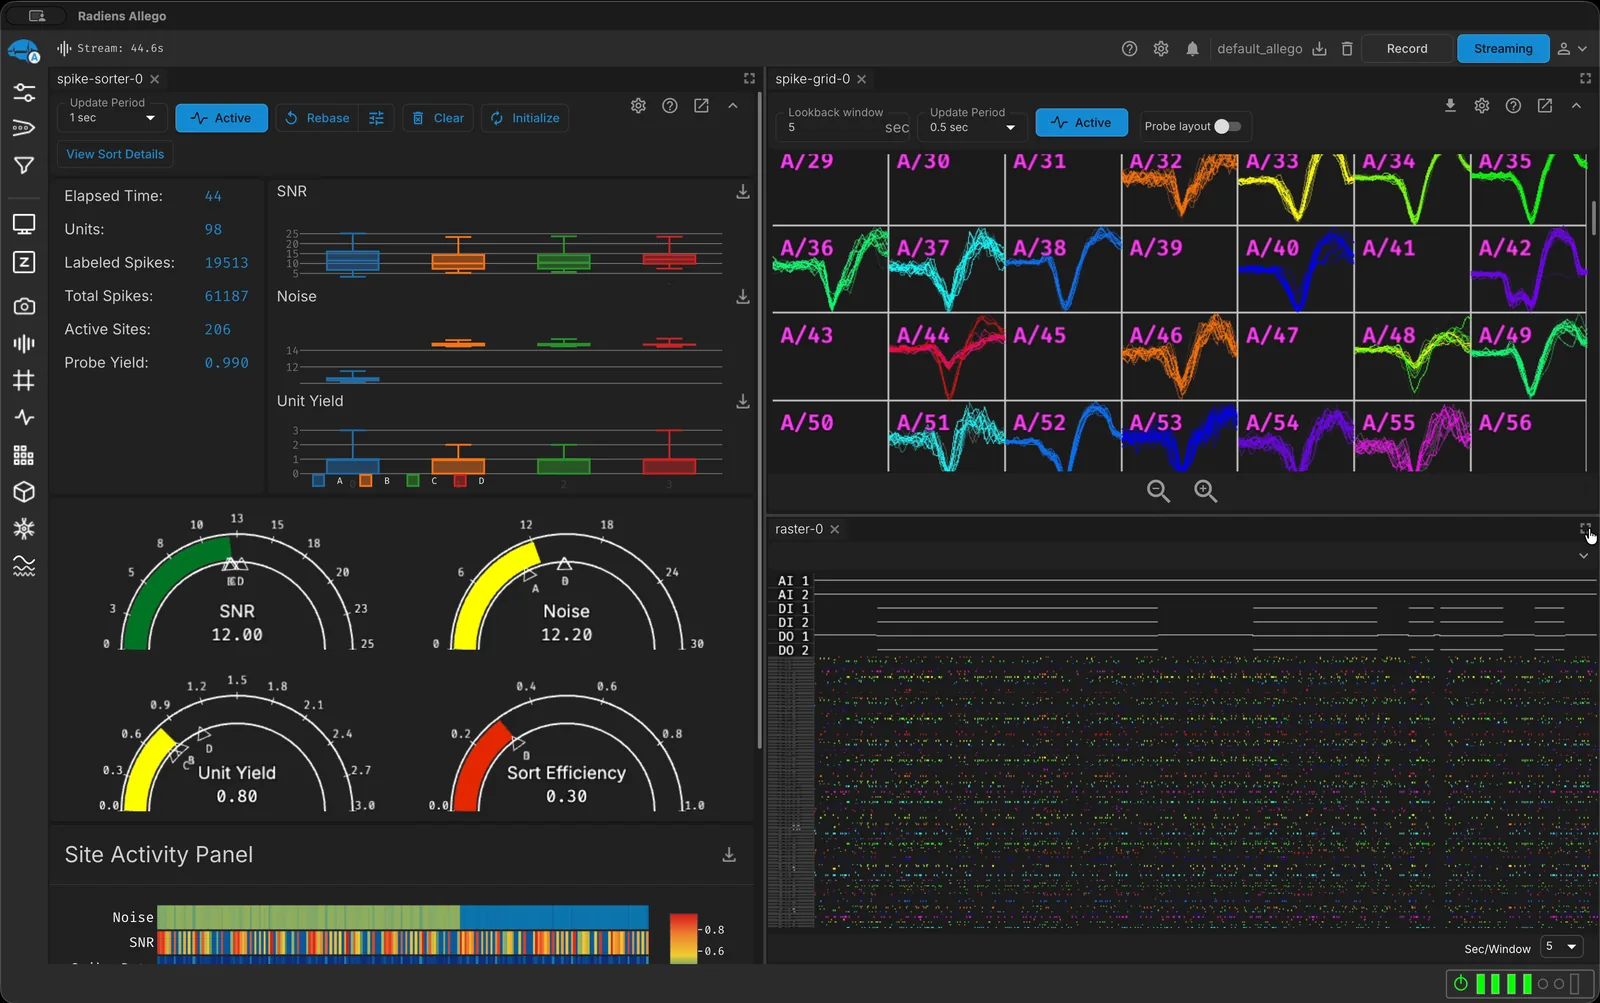
Sort the sites worth sorting, and judge the result on its own dashboard.
How the metrics are calculated
The reference for each metric: blocks, events, the noise estimate and the lookback.
Signal metrics in Radiens — FAQ
What are signal metrics in Radiens?
Signal metrics are per-site measurements of an electrophysiology recording: amplitude metrics such as RMS and noise in µV, event metrics such as event rate in Hz, and signal-to-noise. Allego estimates them as the signal streams in, and Videre computes them exactly from a saved recording, over a lookback you set from 0.5 to 10 seconds. Standard includes 11 of the 15 metrics; Pro adds four event measures.
How does Radiens calculate noise and signal-to-noise?
Noise is 1.4826 times the median absolute deviation of the filtered signal, which equals the standard deviation for Gaussian noise but barely moves with spikes or brief artifacts. Signal To Noise is the mean event size, the average of each event’s largest absolute value, divided by that noise. It is a plain ratio, not decibels. Events are crossings of the spike thresholds you set, so filters and thresholds change both.
Is impedance one of the signal metrics?
No. Impedance is measured by the acquisition hardware and shown in Allego’s Impedance tab; it cannot be computed from a recording. Signal metrics describe the recorded signal itself: its noise, amplitude, events and signal-to-noise. The two answer different questions, the electrode’s condition and the signal it picks up, so check both when a site looks wrong: a high-impedance site often also shows high noise.
Can I get signal metrics for a recording from another acquisition system?
Yes. Open the recording in Videre and the Signal Metrics tab computes the metrics from the file, the same way it does for a Radiens recording. That covers Intan, Open Ephys, Blackrock and TDT recordings, saved or, with Open Live at Pro, still being written. Set the filters and spike thresholds first: metrics are measured on the filtered signal, so compare recordings only under the same settings.
Can I read signal metrics from Python?
Yes. radiens-core, the free RadiensPy client, computes the same metrics through VidereClient: kpicalculate runs them over an open recording, getkpimetrics returns the values per site for any time range, and getkpimetricsseries returns them window by window over time. The numbers match what the Signal Metrics tab shows, because both use the same engine, so one script can check a whole folder of recordings.